Why Most Investors Check the Wrong Numbers First
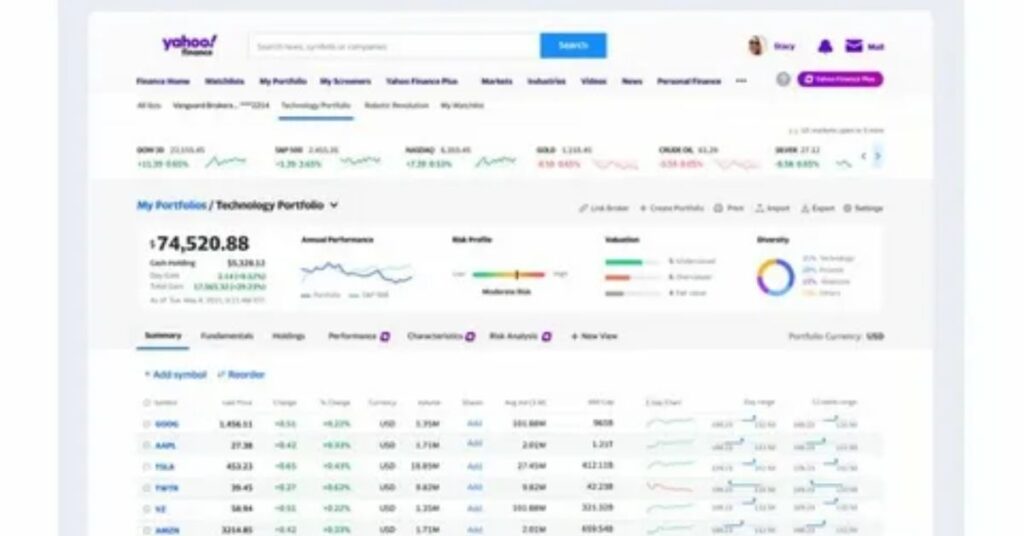
Open any meta yahoo finance page and you’re hit with a wall of numbers. Price, volume, market cap, P/E ratio, beta, and a dozen other figures all compete for attention at once.
Most new investors default to checking the current price and calling it research. That’s a mistake, since price alone says nothing about whether a company’s business is actually healthy.
This guide narrows things down to five metrics that genuinely matter, why each one matters, and how to read them correctly on Yahoo Finance’s platform.
Metric 1: Price to Earnings Ratio
The P/E ratio compares Meta’s current stock price to its earnings per share. It’s one of the first numbers most investors check, and for good reason.
What a High or Low P/E Actually Means
A high P/E generally suggests the market expects strong future growth, while a low one can mean the opposite, or that the stock is undervalued relative to its earnings. Neither is automatically good or bad without context.
Comparing Meta’s P/E against its own historical average, rather than an arbitrary benchmark, often gives a clearer read on whether the current valuation looks stretched or reasonable.
Where to Find It
The P/E ratio appears directly on the Summary tab of Meta’s Yahoo Finance quote page, updated in real time as the stock price moves throughout the trading day.
Metric 2: Revenue Growth Rate
Earnings can be manipulated short term through cost cutting, but revenue growth is harder to fake. It shows whether the core business is actually expanding.
Checking Meta’s year over year revenue growth, found on the Financials tab, reveals whether advertising demand and user engagement are trending in the right direction. A slowing growth rate, even with strong current revenue, often signals something worth investigating further.
Comparing Quarterly Trends
Looking at four or five consecutive quarters, rather than a single report, shows whether growth is accelerating, steady, or decelerating. A single strong quarter means less than a consistent multi quarter pattern.
Metric 3: Operating Margin
Operating margin measures how much profit Meta keeps from every dollar of revenue after covering operating costs. It’s a direct measure of business efficiency.
This metric matters especially for Meta given its heavy spending on Reality Labs and AI infrastructure. A shrinking operating margin during a period of high investment isn’t necessarily alarming, but it’s worth tracking over multiple quarters to see if it stabilizes.
Metric 4: Free Cash Flow
Free cash flow shows how much actual cash a company generates after covering capital expenditures. This figure matters more than headline earnings for a company making large AI infrastructure investments.
Meta’s ability to fund its own growth without relying heavily on debt depends largely on this number. Strong free cash flow gives a company flexibility, while weak free cash flow despite reported profit can be a warning sign.
According to Investopedia, free cash flow is often considered a more reliable indicator of financial health than net income alone, since it strips out non-cash accounting adjustments that can distort a company’s reported profitability.
Metric 5: Debt to Equity Ratio
This ratio compares a company’s total debt to shareholder equity, showing how much of the business is financed through borrowing versus ownership capital.
A lower ratio generally indicates a more conservative balance sheet, while a higher one suggests heavier reliance on debt financing. For a company like Meta funding massive AI and infrastructure spending, tracking this ratio over time shows whether that spending is being financed responsibly.
Putting These Five Metrics Together
No single metric tells the full story on its own. A strong P/E ratio paired with declining revenue growth paints a different picture than the same P/E paired with accelerating growth.
The real value comes from checking these five numbers together each quarter, rather than fixating on any single figure in isolation. Over time, this builds a clearer sense of whether Meta’s underlying business is strengthening or weakening.
A Simple Quarterly Checklist
- Pull the current P/E and compare it to Meta’s 3-year average
- Check year over year revenue growth against the prior four quarters
- Review operating margin trends alongside Reality Labs spending updates
- Confirm free cash flow remains strong relative to capital expenditures
- Track debt to equity ratio for any meaningful shifts
Where to Find All Five Metrics on Yahoo Finance
Each of these metrics lives in a slightly different section of Meta’s quote page, which can make manual tracking tedious without a system.
The Statistics tab houses the P/E ratio and debt to equity figures. The Financials tab covers revenue growth, operating margin, and free cash flow, broken out by quarter and by year.
Bookmarking these two tabs specifically, rather than starting from the general Summary page each time, saves meaningful time during a quarterly review routine.
Common Mistakes When Reading These Metrics
A few habits consistently trip up newer investors working through meta yahoo finance data.
Comparing Meta’s metrics directly against a completely different industry’s benchmarks leads to false conclusions. A software company’s typical margins look nothing like a retailer’s, so context matters.
Reacting to a single quarter’s dip in any one metric, without checking the broader multi quarter trend, often leads to premature decisions. One weak quarter rarely tells the full story on its own.
Ignoring the four other metrics because one number looks impressive is another common trap. A great P/E ratio means little if free cash flow is deteriorating at the same time.
FAQs
What is the most important metric to check on Meta’s Yahoo Finance page?
There isn’t a single most important metric, since P/E ratio, revenue growth, operating margin, free cash flow, and debt to equity each reveal different aspects of financial health. Checking them together gives a far more complete picture than relying on any one figure.
Where can I find Meta’s P/E ratio on Yahoo Finance?
Meta’s P/E ratio appears on the Summary tab of its stock quote page, updated throughout the trading day. It’s also listed in more detail on the Statistics tab alongside other valuation metrics.
How often does Meta’s revenue growth rate update on Yahoo Finance?
Revenue growth figures update quarterly, following each earnings report. The Financials tab shows both quarterly and annual historical data for easy comparison.
Is a high operating margin always a good sign for Meta stock?
Generally yes, but context matters, especially during periods of heavy investment like Reality Labs spending. A temporarily lower margin during an investment phase isn’t necessarily a red flag if it stabilizes over time.
Why does free cash flow matter more than net income for Meta?
Free cash flow strips out non-cash accounting items and shows the actual cash a company generates after capital spending. For a company investing heavily in AI infrastructure, this figure often gives a clearer picture of financial flexibility than net income alone.
What does a rising debt to equity ratio suggest about Meta?
A rising ratio suggests Meta is relying more heavily on debt financing relative to shareholder equity. This isn’t automatically negative, but it’s worth monitoring alongside free cash flow to ensure the debt load remains manageable.
Can I track all five of these metrics for free on Yahoo Finance?
Yes, all five metrics are available on Yahoo Finance’s free tier through the Summary, Statistics, and Financials tabs. No paid subscription is required to access this level of financial detail.
Final Verdict
Checking meta yahoo finance data effectively comes down to knowing which five numbers actually matter and reading them together rather than in isolation. P/E ratio, revenue growth, operating margin, free cash flow, and debt to equity each tell part of the story, and skipping any one of them leaves gaps in the picture.
Building a simple quarterly habit around these five metrics takes less time than it sounds and produces far better insight than scanning the current stock price alone.
Investors who commit to this kind of consistent, focused review tend to make more informed decisions than those reacting to daily price movement or headline news without checking the underlying numbers first.
This article is for informational purposes only and does not constitute financial advice. Always do your own research or consult a licensed financial advisor before making investment decisions.

